
Chapter 4 - Introduction to technical indicators
Lesson 4.2 - Stochastic Oscillator

Stochastic oscillator is the momentum indicator that uses support and resistance levels. Dr. George Lane developed this indicator in the late 1950s. Stochastic oscillator refers to the current price point in relation to its price range over a specific period of time. This method attempts to predict price shift points by comparing the closing price of a security with its price range.
To add Stochastic oscillator to MetaTrader 4 platform if the interface of the platform is in English, you need to do the following:
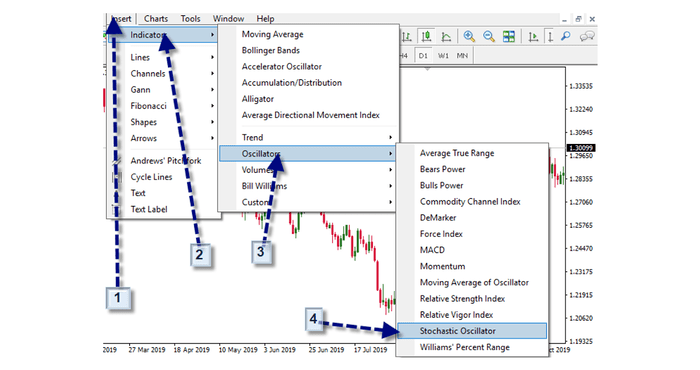
3- Click on the “insert” tab .
2- Click on the indicators
3- Click on the word “oscillators”
4- Click on the word “Stochastic Oscillator”
After clicking on the word “Stochastic Oscillator” and choosing the desired indicator, the following interface will appear to us:
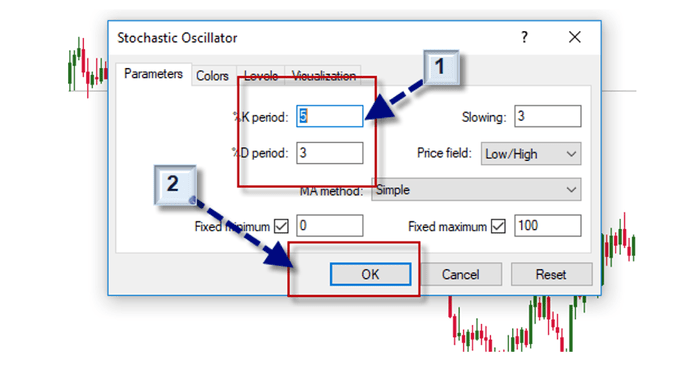
1- The Stochastic Oscillator settings are adjusted according to the technical analyst desire.
2- Click “OK”, so we have the oscillator on the trading platform as it appears in the following form:

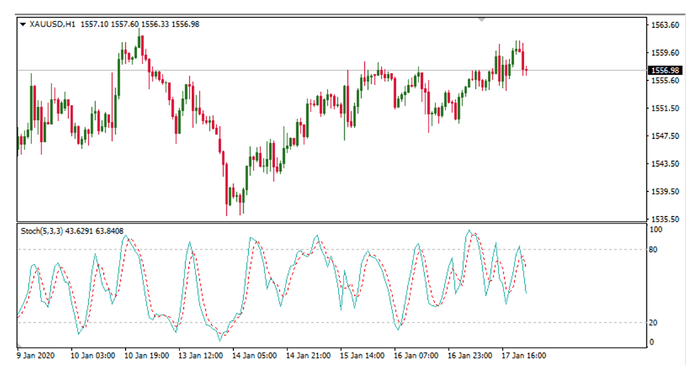
The previous figure shows the stochastic oscillator with default settings on the MetaTrader 4 platform, the XAU\ USD chart.
The 5- period stochastic oscillator is defined in a daily time frame as follows:
Where H5 and L5 are the highest and lowest prices in the last 5 days in a row, while %D is the 3-day moving average of %K (last 3 values of K). This is usually a simple moving average, but it can also be an exponential moving average for a less record weight for more recent values. There is only one valid signal in working with D% alone - the difference between % D and the analysed safety.
In other words, the stochastic oscillator consists of two lines % K and %D, fluctuating between 0 and 100. The K-line represents the change in the closing price in relation to the up and down in the specified period while the D-line is the fast K-means during another specified period. The periods that Lane suggests for %K and %D are 14 for the K-line and 3 for the D-line, although some traders use 9 for the K-line and 5 for the D-line.
The oscillator uses random oscillations to determine when closing prices combine together in the declining of the advanced trend, in an attempt to identify potential entry and exit points.
How are stochastic oscillator measurements calculated?
To calculate the stochastic oscillator, you need to calculate both the K-line followed by the D-line.
First, the K-line is calculated by subtracting the most recent closing price (CP) from the lowest closing price for the period and dividing it by the different high and low closing prices for that period. The formula is:
( Latest CP - Lowest CP ) / ( Highest CP - Lowest CP )
Next, the D-line is calculated with an average of the K values for the D-line period. This is calculated by averaging the sum of the values of K for the D period and dividing them by the D period. The formula is:
( K + %K + ... n ) / n%
Where n is the D- line period. If the standard D-line is used, so the sum of the last three K values will be divided by 3.
How is the Stochastic oscillator used?
There are several ways in which the stochastic oscillator can be used. Heavy readings occur when the fastest K-line approaches 0 or 100.
When the K-line is near 100, prices are believed to be overbought and when it is near 0, prices are believed to be in oversold territory. However, prices can remain in the overbought or oversold territory for a while.
A more reliable entry and exit signal is generated more slowly when the K-line crosses the D-transmission line when it is overbought or oversold. This indicates an imminent reversal in the short-term trend.
Thus, a possible entry signal is generated when the K- line crosses the D-line in the oversold condition, i.e. when the stochastic oscillator is less than 20. A possible exit signal is generated when the K-line crosses the D- line in overbought condition, i.e. the random oscillator is above 80.
As with other oscillators, a positive and negative deviation occurs between the random oscillator and prices. This is when the peak in the price chart and the random oscillators trend lines descend in different directions. When divergence differs, a possible price reversal may follow.
Finally, George Lane also referred to a flat K or D line as hinges, indicating that the hinge may indicate that the current trend has been exhausted and that the probability of a price reversal is high.
An illustrative example of the stochastic oscillator chart
The previous chart shows the stochastic oscillator 5,3,3 in the lower chart board on the 60-minute chart for XAU\ USD. The blue line is the raw stochastic oscillator while the red dashed line is the signal line.